

Data & Analytics.
Visualization, processing and decision support
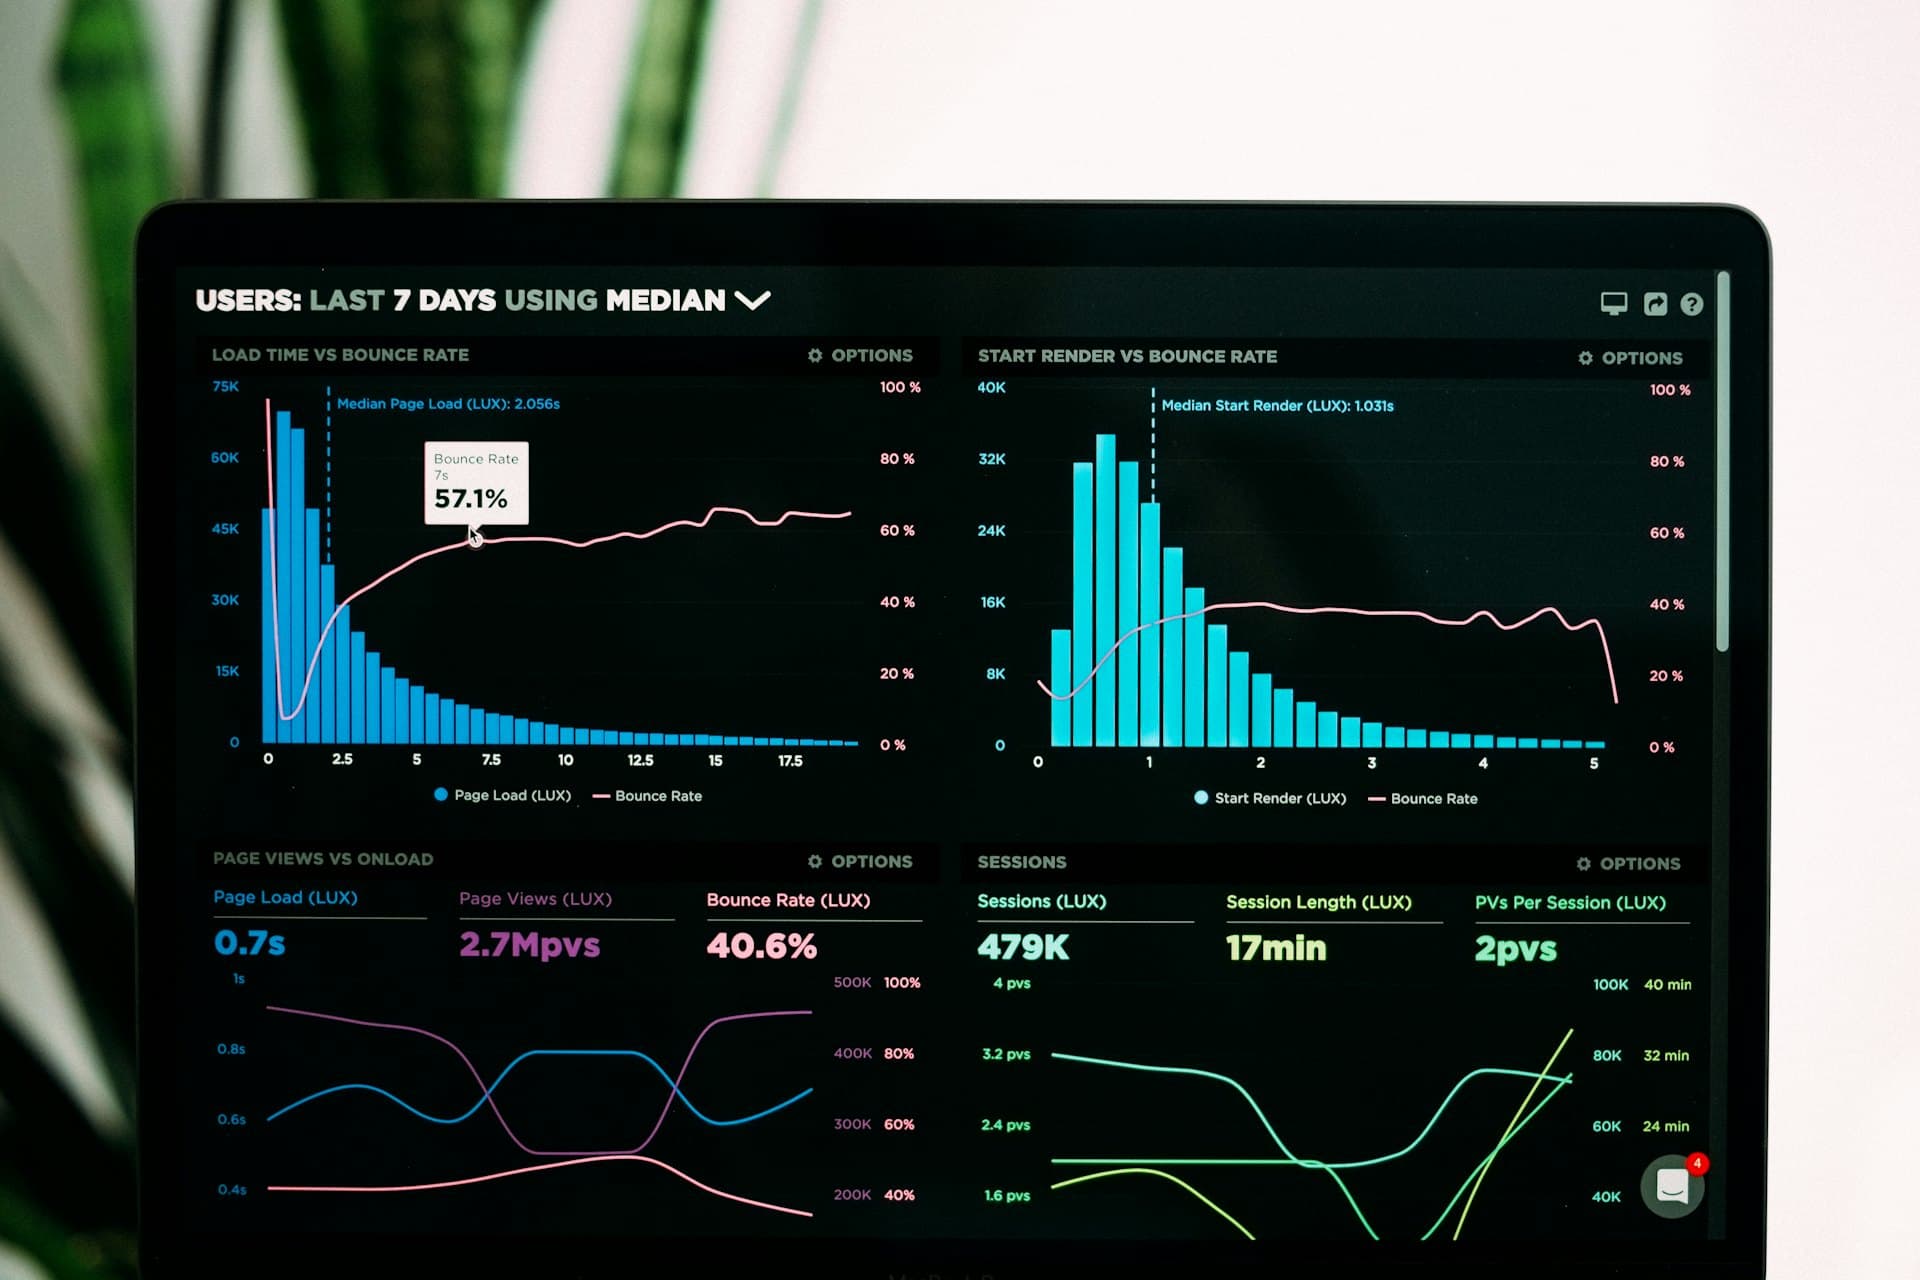
Your data is a goldmine — if you can tap into it. We design data architectures that collect, clean, transform and surface your data in tools everyone can use: real-time dashboards, automated reports and predictive models. Our conviction: data should serve decisions, not the other way around.
- 01Interactive dashboards
- 02Data pipelines
- 03Predictive models
- 04Decision support
What you gain.
Real-time steering
Dynamic dashboards to track your KPIs and react at the right moment.
Unified data
A single source of truth, fed automatically from all your systems.
Grounded decisions
No more guesswork or sterile debate: facts inform the conversation.
Hidden insights
Advanced analyses that reveal patterns invisible to the naked eye.
In practice,
what does it look like?
Executive dashboard
A unified view of critical KPIs for leadership, updated in real time.
Data warehouse
Centralize all your business data in a single analytical warehouse.
Automated reports
Automatic generation and distribution of periodic reports for your teams.
Predictive analytics
Anticipate customer, operational or financial trends to decide better.
How we move forward together.
Data audit
Inventory of your sources, data quality, priority business needs.
Data architecture
Pipeline design: ingestion, storage, transformation, delivery.
Build & deployment
Setting up the infrastructure and the first dashboards.
Adoption & governance
User training, governance to keep the tool alive.